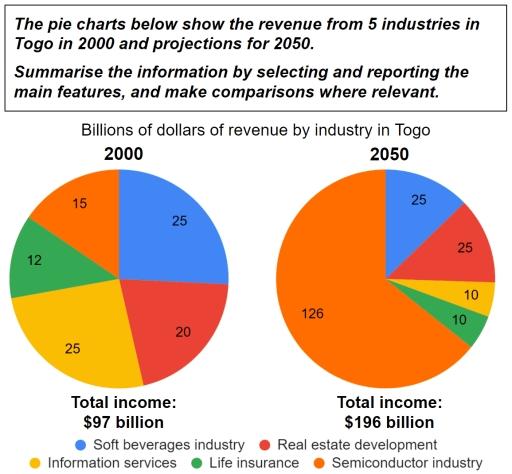
The pie chart below show the rebenue from 5 industries in Togo in 2000 and projections for 2050
A full IELTS Academic Writing Task 1 answer to this pie chart at Band 6.0, 7.0, 8.5, with the four-part structure, the comparison language it needs, and why each version scores what it does.
The question
You should spend about 20 minutes on this task.
The pie chart below show the rebenue from 5 industries in Togo in 2000 and projections for 2050.
Summarise the information by selecting and reporting the main features, and make comparisons where relevant.
Write at least 150 words.
Revenue from five industries in Togo in 2000, with projections for 2050, in billions of dollars.
What to select from this pie chart
The crucial detail is in the labels: these pie charts show billions of dollars, not percentages, and the totals differ — $97 billion against $196 billion. That means a slice can shrink as a share while its cash value stays the same, which is exactly what happens to four of the five industries. Describing this chart in percentages would misrepresent it completely.
Structure
Introduction — Paraphrase: what is measured, for which country, in which years, in what units, noting the totals differ and 2050 is a projection.
Overview — No figures: total revenue is projected to roughly double, driven entirely by semiconductors, while the other four industries stay flat or decline in cash terms.
Body 1 — Semiconductors — the scale of the growth and its share of the total.
Body 2 — The other four industries, which barely move in dollars despite their shares collapsing.
Model answers
Band 6.0 model answer
169 words
The two pie charts show the money that five industries earned in Togo in 2000 and how much they will earn in 2050. The numbers are billions of dollars.
In 2000 the total income was $97 billion. The biggest industries were soft beverages and information services, both with $25 billion. Real estate development was $20 billion, the semiconductor industry was $15 billion and life insurance was the smallest with $12 billion.
In 2050 the total income will be $196 billion, so it will be about two times bigger than in 2000.
The semiconductor industry will increase enormously, from $15 billion to $126 billion. It will become much bigger than all the other industries together.
The other industries will not increase. Soft beverages and real estate will stay at $25 billion, information services will decrease to $10 billion and life insurance will decrease to $10 billion.
In conclusion, all the growth in Togo will come from the semiconductor industry, and the other industries will stay the same or become smaller.
Why this is Band 6.0
Both charts are covered with accurate figures including the totals, which secures Task Achievement at this level.
The units are stated but the answer occasionally slips towards describing slices as though they were percentages.
Vocabulary is adequate but repetitive: increased, billion and industry recur throughout.
Sentences are mainly simple and compound, with one figure per clause.
Band 7.0 model answer
214 words
The two pie charts compare revenue from five industries in Togo in 2000 with projections for 2050, measured in billions of dollars. The totals differ, at $97 billion and $196 billion respectively.
Overall, national revenue is projected to roughly double over the fifty years, but this growth is entirely attributable to one industry. Semiconductors are expected to expand enormously, while the remaining four sectors are forecast to remain static or to decline in cash terms.
In 2000 revenue was distributed fairly evenly. Soft beverages and information services led jointly at $25 billion each, followed by real estate development at $20 billion, semiconductors at $15 billion and life insurance at $12 billion — a spread of only $13 billion between the largest and smallest.
By 2050 that balance is projected to disappear. Semiconductor revenue is expected to reach $126 billion, more than eight times its 2000 level and considerably more than the other four industries combined. Soft beverages and real estate are forecast to remain unchanged in absolute terms, at $25 billion and $25 billion, while information services fall to $10 billion and life insurance to $10 billion. It should be noted that although these four occupy much smaller slices in 2050, this reflects the far larger total rather than any collapse in their earnings.
Why this is Band 7.0
The overview is separate, arrives early and identifies semiconductors as the sole source of growth.
The distinction between cash value and share of the total is handled correctly.
Future forms are used for the projected figures.
Less common lexis is used accurately: revenue, projected, stagnant, in absolute terms.
Band 8.5 model answer
289 words
The two pie charts compare revenue from five industries in Togo in 2000 with projections for 2050. Crucially, the figures are given in billions of dollars rather than as percentages, and the totals are not the same: $97 billion in 2000 against a forecast $196 billion in 2050.
Overall, the country's revenue is projected to roughly double, yet the whole of that increase comes from a single sector. Semiconductors are expected to grow more than eightfold, while the other four industries either stand still or fall slightly in cash terms — so an economy that was broadly balanced in 2000 becomes heavily concentrated by 2050.
In 2000 the five industries were closely matched. Soft beverages and information services each generated $25 billion, real estate development $20 billion, semiconductors $15 billion and life insurance $12 billion, giving a range of just $13 billion across the whole chart. No industry accounted for much more than a quarter of national revenue.
The 2050 projection is dominated by one figure. Semiconductor revenue is forecast at $126 billion — an increase of $111 billion, which is more than the entire national total in 2000 and greater than the other four industries combined by a factor of more than two. Against this, soft beverages and real estate are both projected at $25 billion, unchanged and marginally higher respectively, while information services and life insurance each fall to $10 billion.
The apparent shrinking of those four slices is therefore largely a dilution effect rather than a decline: three of them are worth the same or more in dollars than in 2000, and only information services loses substantial value. What has changed is not their earnings but the size of the total they are being measured against.
Why this is Band 8.5
The overview identifies both the doubling of the total and the fact that a single industry produces all of it.
Explicitly separates share from absolute value, which is the key to reading pie charts with different totals in currency units.
Notes that four industries appear to shrink only because the total grew, which is the most commonly missed point on this task.
Lexis is precise and economical: revenue, projected, in absolute terms, dilution, concentrated.
Complex structures are used flexibly, including a fronted concessive, an appositive and a participle clause, with figures embedded naturally.
Model answers written and reviewed by The English All-in-One IELTS team. They are teaching models showing what each band looks like, not real candidate scripts.
This is a pie chart question. The answers above show you what each band looks like when it is finished. What they cannot show you is how to get there from a blank page in forty minutes.
That is what our Writing Study Library is for: the structure we teach for this exact question type, the paragraph pattern that goes with it, and the sentence openers for each stage — so the essay is planned before you start writing rather than assembled as you go.
Why does it matter that the pie charts show dollars, not percentages?
Because a slice can look much smaller while being worth exactly the same money. Here four industries appear to shrink dramatically, but three of them hold their cash value — the total simply doubled around them. Reading this chart as percentages would produce a description that is confidently wrong.
How do I express that difference clearly?
Use the phrase "in absolute terms" or "in cash terms" when you mean the dollar figure, and "share" or "proportion" when you mean the slice. Naming which one you are talking about in each sentence keeps a comparison like this accurate.
Should I compare the totals directly?
Yes — they are given, and the doubling from $97 to $196 billion is a main feature. It also lets you say something no slice shows: that the entire increase is accounted for by one industry's growth of $111 billion.
How do I write about a projection this dramatic?
Report it neutrally with future forms and let the figures speak. Saying semiconductors are "expected to reach $126 billion, more than the entire national total in 2000" conveys the scale without editorialising about whether the forecast is plausible.