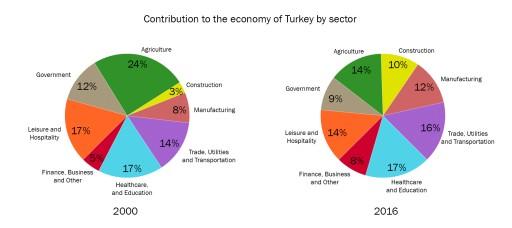
The two pie charts below show the percentages of industry sectors' contribution to the economy of Turkey in 2000 and 2016
A full IELTS Academic Writing Task 1 answer to this pie chart at Band 6.0, 7.0, 8.5, with the four-part structure, the comparison language it needs, and why each version scores what it does.
The question
You should spend about 20 minutes on this task.
The two pie charts below show the percentages of industry sectors' contribution to the economy of Turkey in 2000 and 2016.
Summarise the information by selecting and reporting the main features, and make comparisons where relevant.
Write at least 150 words.
Percentage contribution of eight sectors to the economy of Turkey, 2000 and 2016.
What to select from this pie chart
Eight sectors is too many to take one at a time, so group them by direction and lead with the sector that changed the ranking. Agriculture losing ten points is the largest movement in absolute terms, but construction more than tripling is the largest proportionally — mentioning both, and distinguishing them, is what a Band 8 answer does. One sector is identical in both years, which is worth a clause precisely because everything else moved.
Structure
Introduction — Paraphrase: what is measured, for which country, in which two years, as percentages of the economy.
Overview — No figures: agriculture declined sharply and lost its position as the largest sector, while construction and manufacturing grew, leaving the economy more evenly spread.
Body 1 — The sectors that fell — agriculture, government and leisure — with agriculture's loss of first place.
Body 2 — The sectors that grew, plus the one that did not move at all.
Model answers
Band 6.0 model answer
197 words
The two pie charts show how much eight different sectors contributed to the economy of Turkey in 2000 and in 2016.
In 2000 agriculture was the biggest sector with 24 per cent. Healthcare and education and leisure and hospitality were both 17 per cent, and trade, utilities and transportation was 14 per cent. Government was 12 per cent, manufacturing 8 per cent, finance and business 5 per cent and construction only 3 per cent.
In 2016 the situation changed. Agriculture decreased a lot, from 24 per cent to only 14 per cent, so it was not the biggest sector anymore. Healthcare and education stayed exactly the same, 17 per cent, and became the biggest sector.
Construction increased the most in comparison with its old number, from only 3 per cent to 10 per cent. Manufacturing also increased from 8 per cent to 12 per cent, and finance and business increased from 5 per cent to 8 per cent.
Government decreased from 12 per cent to 9 per cent and leisure and hospitality decreased from 17 per cent to 14 per cent.
In conclusion, agriculture became much smaller and construction and manufacturing became bigger in the Turkish economy.
Why this is Band 6.0
All eight sectors are covered for both years with accurate figures, which secures Task Achievement at this level.
The sectors are worked through in order rather than grouped, so the change in ranking is reported late.
Vocabulary is adequate but repetitive: per cent, increased and sector recur throughout.
Sentences are mainly simple and compound, with one figure per clause.
Band 7.0 model answer
217 words
The two pie charts compare the percentage contribution of eight sectors to the Turkish economy in 2000 and 2016.
Overall, agriculture declined steeply and lost its place as the leading sector, while construction and manufacturing both expanded considerably. The result is an economy noticeably more evenly distributed across its sectors in 2016 than in 2000.
Three sectors contracted. Much the largest fall was in agriculture, which dropped from 24 to 14 per cent — a loss of ten percentage points, and enough to displace it from first position to joint third. Leisure and hospitality declined more modestly from 17 to 14 per cent, and government from 12 to 9 per cent.
Four sectors grew, and the most striking increase was in construction, which rose from just 3 to 10 per cent. In absolute terms this is only seven points, but it represents more than a tripling and is by far the largest proportional change on either chart. Manufacturing climbed from 8 to 12 per cent, trade, utilities and transportation from 14 to 16 per cent, and finance and business from 5 to 8 per cent. Healthcare and education was the single sector to remain unchanged, holding at 17 per cent — which, because everything above it fell, was enough to make it the largest sector in 2016.
Why this is Band 7.0
The overview is separate, arrives early and identifies both the decline of agriculture and the change in which sector leads.
Sectors are grouped by direction of change rather than listed, which produces comparison.
Proportional change is distinguished from percentage-point change, particularly for construction.
Less common lexis is used accurately: displaced, tripled, marginal, at the expense of.
Band 8.5 model answer
261 words
The two pie charts compare the share of the Turkish economy contributed by eight sectors in 2000 and in 2016.
Overall, the economy became markedly less concentrated over the period. Agriculture, which dominated in 2000, fell sharply and surrendered first place, while construction and manufacturing expanded, producing a considerably flatter distribution in which no sector accounts for more than 17 per cent.
Agriculture accounts for the largest single movement on either chart, contracting from 24 to 14 per cent. That ten-point loss is greater than any other change in absolute terms and cost the sector its leading position, leaving it level with leisure and hospitality in joint third. The other two declines were smaller: leisure and hospitality slipped from 17 to 14 per cent and government from 12 to 9 per cent.
Growth was concentrated in the productive sectors. Construction rose from 3 to 10 per cent — seven points, but proportionally more than a tripling and comfortably the largest relative change anywhere on the charts. Manufacturing gained four points to reach 12 per cent, finance and business three to reach 8 per cent, and trade, utilities and transportation two to reach 16 per cent, which lifted it into second place.
Healthcare and education is the one sector to record no change at all, remaining at exactly 17 per cent in both years. It nonetheless finished as the largest contributor to the economy, having been joint second in 2000 — a position gained entirely by default, through the decline of agriculture above it rather than through any growth of its own.
Why this is Band 8.5
The overview names the decline of agriculture, the change in ranking and the flattening of the distribution, which together describe the charts fully without figures.
Handles the unchanged sector analytically — it leads in 2016 without having grown, purely because others fell.
Distinguishes absolute from proportional change explicitly, so construction and agriculture are each measured on the right scale.
Lexis is precise and economical: displaced, at the expense of, proportionally, flatter distribution, by default.
Complex structures are used flexibly, with a fronted concessive, an appositive and a participle clause, and figures embedded naturally.
Model answers written and reviewed by The English All-in-One IELTS team. They are teaching models showing what each band looks like, not real candidate scripts.
This is a pie chart question. The answers above show you what each band looks like when it is finished. What they cannot show you is how to get there from a blank page in forty minutes.
That is what our Writing Study Library is for: the structure we teach for this exact question type, the paragraph pattern that goes with it, and the sentence openers for each stage — so the essay is planned before you start writing rather than assembled as you go.
Which is the bigger change — ten points or a tripling?
They are different measures and a strong answer reports both. Agriculture's ten-point fall is the largest absolute change; construction going from 3 to 10 per cent is the largest proportional one. Naming which measure you are using each time is what keeps the comparison accurate.
What do I say about a sector that did not change?
Say it stayed the same, and then say what that meant. Here healthcare and education held at 17 per cent yet became the largest sector, purely because agriculture fell below it. That is a genuine finding and it only appears if you look at the ranking as well as the figures.
How do I handle eight categories in 170 words?
Group them into those that rose and those that fell, lead each group with its biggest mover, and cover the rest in a single sentence. Eight separate sentences would use all your words and demonstrate no selection.
Can I describe the economy as becoming more balanced?
Yes, because that is visible in the figures: the largest sector fell from 24 to 17 per cent and the smallest rose from 3 to 8. Describing the shape of a distribution is reporting the data. Explaining why Turkey's economy changed would not be.