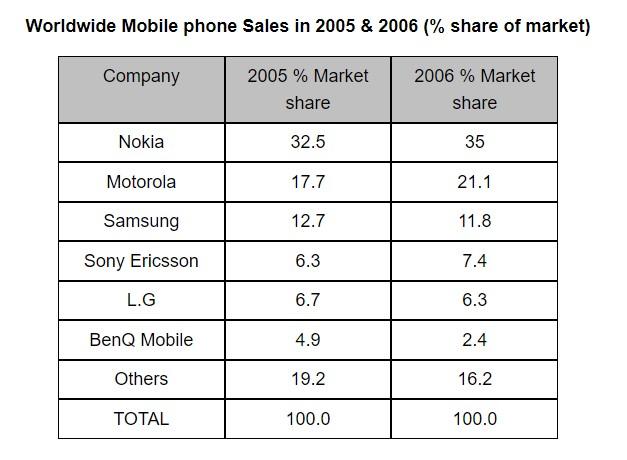
The table shows the worldwide market share of the mobile phone market for manufactures in the years 2005 and 2006
A full IELTS Academic Writing Task 1 answer to this table at Band 6.0, 7.0, 8.5, with the four-part structure, the comparison language it needs, and why each version scores what it does.
The question
You should spend about 20 minutes on this task.
The table shows the worldwide market share of the mobile phone market for manufactures in the years 2005 and 2006.
Summarise the information by selecting and reporting the main features, and make comparisons where relevant.
Write at least 150 words.
Worldwide mobile phone market share by manufacturer, 2005 and 2006, in percentages.
What to select from this table
A table gives you no visual shape, so you have to impose one — and the shape here is that the two largest firms both grew while almost everything below them shrank. That is consolidation, and naming it is worth more than reciting seven rows. The two figures that stand out are BenQ, which lost more than half its share, and Others, whose decline confirms that the market was concentrating rather than fragmenting.
Structure
Introduction — Paraphrase: what is measured, for which industry, in which two years, as percentages of the world market.
Overview — No figures: the two market leaders both increased their share while most smaller manufacturers lost ground, so the market became more concentrated.
Body 1 — The gainers — Nokia and Motorola, with Sony Ericsson as the only other riser.
Body 2 — The losers — Samsung, LG, BenQ and the residual Others category, with BenQ's collapse highlighted.
Model answers
Band 6.0 model answer
163 words
The table shows the share of the world mobile phone market for six companies in 2005 and 2006, and also a group called Others.
Nokia was the biggest company in both years. Its share increased from 32.5 per cent in 2005 to 35 per cent in 2006. Motorola was the second company and it also increased, from 17.7 per cent to 21.1 per cent.
Samsung was in third position, but its share decreased a little, from 12.7 per cent to 11.8 per cent. Sony Ericsson increased from 6.3 per cent to 7.4 per cent, but L.G decreased from 6.7 per cent to 6.3 per cent.
The biggest fall was BenQ Mobile. Its share decreased from 4.9 per cent to only 2.4 per cent, so it lost about half. The category Others also decreased, from 19.2 per cent to 16.2 per cent.
In conclusion, the two biggest companies increased their share, but most of the smaller companies lost some of their share in 2006.
Why this is Band 6.0
All rows are covered with accurate figures, which secures the basis of Task Achievement.
The table is read down the rows rather than grouped, so the overall pattern has to be inferred.
Vocabulary is adequate but repetitive, with market share, increased and decreased carrying most of the meaning.
Sentences are mainly simple and compound, with one figure per clause.
Band 7.0 model answer
189 words
The table compares the share of the worldwide mobile phone market held by six manufacturers, together with a residual category of other producers, in 2005 and 2006.
Overall, the two market leaders strengthened their positions while most of the smaller manufacturers lost ground, so the market became noticeably more concentrated over the single year. The steepest decline by far was suffered by BenQ Mobile.
Only three companies increased their share. Nokia, already dominant at 32.5 per cent in 2005, extended its lead to 35 per cent, while Motorola made the largest single gain, rising by 3.4 points from 17.7 to 21.1 per cent. Sony Ericsson was the only other riser, moving modestly from 6.3 to 7.4 per cent.
The remaining manufacturers all declined. Samsung slipped from 12.7 to 11.8 per cent and L.G from 6.7 to 6.3 per cent, both marginal reductions. BenQ Mobile, by contrast, more than halved, falling from 4.9 to just 2.4 per cent. The Others category also contracted, from 19.2 to 16.2 per cent, which indicates that the gains of the leading firms came largely at the expense of smaller producers outside the named six.
Why this is Band 7.0
The overview is separate, arrives early and identifies consolidation as the main development rather than listing movements.
Manufacturers are grouped by direction of change, which produces comparison rather than recitation.
Less common lexis is used accurately: consolidate, residual, at the expense of, marginal.
Proportional change is distinguished from percentage-point change, particularly for BenQ.
Band 8.5 model answer
248 words
The table compares the worldwide market share of six mobile phone manufacturers, plus a residual category of all other producers, in 2005 and 2006.
Overall, the market consolidated over the year: the two largest firms both expanded while the majority of their smaller competitors contracted. The most dramatic movement was at the bottom of the table, where BenQ Mobile lost more than half its share.
Growth was confined to three manufacturers, and overwhelmingly to the top two. Nokia, already commanding roughly a third of the market at 32.5 per cent, added a further 2.5 points to reach 35 per cent. Motorola gained more in absolute terms, climbing 3.4 points from 17.7 to 21.1 per cent — the largest single increase in the table, and enough to narrow the gap behind Nokia. Sony Ericsson rose more modestly, from 6.3 to 7.4 per cent.
Everything else lost ground, though by very different margins. Samsung and L.G declined only slightly, from 12.7 to 11.8 and from 6.7 to 6.3 per cent respectively, whereas BenQ Mobile fell from 4.9 to 2.4 per cent — a loss of just 2.5 points in absolute terms, but proportionally more than half of its entire position. The Others category is the most revealing row: its contraction from 19.2 to 16.2 per cent shows that the leaders were not simply taking share from one another but from the fragmented tail of the market, which is what makes consolidation rather than competition the accurate description of the year.
Why this is Band 8.5
The overview identifies market consolidation as the organising feature, which is an accurate reading of the whole table rather than a summary of individual rows.
Uses the Others row analytically — its decline is what shows where the leaders' gains came from — which is the most sophisticated observation available here.
Distinguishes absolute from proportional change explicitly, so BenQ's collapse is measured correctly.
Lexis is precise and economical: consolidation, residual, at the expense of, fragmented, proportionally.
Complex structures are used flexibly, including a fronted adverbial, an appositive and a participle clause, with figures embedded naturally.
Model answers written and reviewed by The English All-in-One IELTS team. They are teaching models showing what each band looks like, not real candidate scripts.
This is a table question. The answers above show you what each band looks like when it is finished. What they cannot show you is how to get there from a blank page in forty minutes.
That is what our Writing Study Library is for: the structure we teach for this exact question type, the paragraph pattern that goes with it, and the sentence openers for each stage — so the essay is planned before you start writing rather than assembled as you go.
How do I make a table interesting when there is no shape to describe?
Impose the shape yourself by grouping rows — here, those that rose and those that fell — and name the overall pattern in the overview. A table read top to bottom produces a list; a table grouped by behaviour produces comparison, which is what the task asks for.
What should I do with an "Others" row?
Do not skip it. It is often the most informative line, because a falling Others tells you the named firms grew at the expense of the wider market rather than at each other's expense. Using it analytically is one of the clearest ways to lift a table answer.
BenQ fell by only 2.5 points — is that worth highlighting?
Yes, because proportionally it lost over half its share, which is the largest relative movement in the table. Judging significance by proportion as well as by points is exactly the discrimination that separates Band 7 and above from mechanical reporting.
Should I check that the figures add to 100?
It is worth a glance, since the table states a total of 100 in both columns. Noting that the shares are exhaustive lets you make claims about where gains came from — but do not spend words on the arithmetic itself.