
Table Task 1 Academic

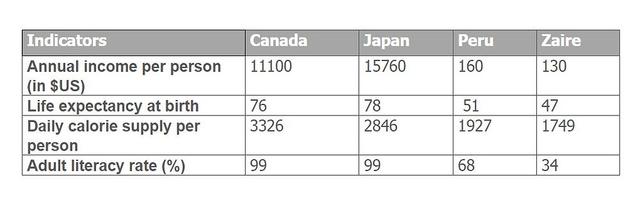
The table below shows social and economic indicators for four countries in 1994, according to United Nations statistics

A full IELTS Academic Writing Task 1 answer to this table at Band 6.0, 7.0, 8.5, with the four-part structure, the comparison language it needs, and why each version scores what it does.

The question

You should spend about 20 minutes on this task.

The table below shows social and economic indicators for four countries in 1994, according to United Nations statistics.

Summarise the information by selecting and reporting the main features, and make comparisons where relevant.

Write at least 150 words.

Table of four indicators for Canada, Japan, Peru and Zaire in 1994. Annual income per person is $15,760 in Japan and $11,100 in Canada against $160 in Peru and $130 in Zaire. Life expectancy is 78 and 76 years against 51 and 47. Daily calorie supply is 3,326 and 2,846 against 1,927 and 1,749, and adult literacy is 99 per cent in both wealthy countries against 68 and 34 per cent.
Social and economic indicators for Canada, Japan, Peru and Zaire, 1994 (United Nations).

What to select from this table

Four indicators in four different units, but they all point the same way, and that is the finding: the countries split cleanly into two pairs on every single measure with no overlap anywhere. Group them rather than working down the rows. The most striking comparison is the income gap, which is a matter of multiples rather than percentages — Japan's figure is roughly a hundred times Zaire's, and saying so is far more informative than quoting both numbers.

Structure

Introduction — Paraphrase: which indicators, which four countries, which year, and the source.

Overview — No detail: the four countries fall into two clear groups on every indicator, with Canada and Japan far ahead of Peru and Zaire, and the gap widest by far in income.

Body 1 — Canada and Japan — the wealthier pair, and how closely they resemble each other.

Body 2 — Peru and Zaire — the poorer pair, with the income gap expressed as a multiple.

Model answers

Band 6.0 model answer

169 words

The table gives information about four social and economic indicators in Canada, Japan, Peru and Zaire in 1994, according to the United Nations.

The annual income per person was very different. In Japan it was 15,760 dollars and in Canada 11,100 dollars, but in Peru it was only 160 dollars and in Zaire only 130 dollars.

Life expectancy was also higher in the first two countries. People in Japan lived 78 years and people in Canada 76 years, but in Peru only 51 years and in Zaire only 47 years.

The daily calorie supply was 3,326 in Canada and 2,846 in Japan. In Peru it was 1,927 and in Zaire only 1,749, so it was much lower.

The adult literacy rate was 99 per cent in both Canada and Japan. In Peru it was 68 per cent and in Zaire only 34 per cent, which was the lowest number in the table.

In conclusion, Canada and Japan had much better indicators than Peru and Zaire in all four categories.

Why this is Band 6.0

  • All four indicators are covered for all four countries with accurate figures, which secures Task Achievement at this level.
  • The table is read row by row, so the grouping of the countries is stated only at the end.
  • Vocabulary is adequate but repetitive: higher, lower and country recur throughout.
  • Sentences are mainly simple and compound, with figures presented one per clause.

Band 7.0 model answer

202 words

The table compares Canada, Japan, Peru and Zaire across four social and economic indicators recorded by the United Nations in 1994.

Overall, the four countries divide into two clear pairs on every measure, with Canada and Japan performing substantially better than Peru and Zaire throughout. The disparity is widest by a considerable margin in annual income.

Canada and Japan were closely comparable to one another. Japan recorded the higher income at $15,760 against Canada's $11,100, and marginally the longer life expectancy at 78 years against 76. Canada supplied more calories per person per day, 3,326 compared with 2,846, and adult literacy was identical in both at 99 per cent — effectively universal.

Peru and Zaire were similarly close to each other but at a far lower level. Their incomes stood at just $160 and $130 respectively, meaning the Japanese figure was around a hundred times that of Zaire. Life expectancy was 51 years in Peru and 47 in Zaire, roughly twenty-seven years shorter than in Japan, and daily calorie supply was 1,927 and 1,749, little more than half the Canadian figure. The clearest difference between the two poorer countries was literacy, where Peru's 68 per cent was double Zaire's 34 per cent.

Why this is Band 7.0

  • The overview is separate, arrives early and identifies the two-group split as the defining feature.
  • Countries are grouped by similarity rather than reported row by row, so every paragraph compares.
  • The income gap is expressed as a multiple, which conveys the scale far better than the raw figures.
  • Less common lexis is used accurately: indicator, life expectancy, disparity, near-universal.

Band 8.5 model answer

281 words

The table sets out four social and economic indicators for Canada, Japan, Peru and Zaire in 1994, as recorded by the United Nations.

Overall, the four countries separate into two pairs — Canada and Japan on one side, Peru and Zaire on the other — and this division holds on every indicator without a single exception or overlap. The gap between the pairs is far wider in income than in anything else, and the two poorer countries resemble each other closely except in literacy.

Canada and Japan differ from one another only marginally. Japan led on income at $15,760 against $11,100 and on life expectancy at 78 years against 76, while Canada supplied considerably more food energy, 3,326 calories daily against 2,846. Adult literacy was near-universal in both, at 99 per cent, and is the one measure on which the two are indistinguishable.

The contrast with the second pair is of a different order altogether. Annual income in Peru and Zaire stood at $160 and $130, so the Japanese figure exceeded Zaire's by roughly a hundred times — a difference of two orders of magnitude, whereas none of the other indicators differs even threefold. Life expectancy was 51 and 47 years, some twenty-seven and thirty-one years short of Japan, and daily calorie supply reached only 1,927 and 1,749, a little over half the Canadian level.

Literacy is the one row on which the poorer pair diverge sharply from each other. Peru recorded 68 per cent, well behind Canada and Japan but double Zaire's 34 per cent, which is comfortably the lowest figure anywhere in the table and the only indicator on which one country stands notably apart from the other three.

Why this is Band 8.5

  • The overview names the two-pair structure and the fact that no indicator breaks it, which is the most accurate possible summary of the table.
  • Expresses the income gap as a multiple and the life expectancy gap in years, choosing the right unit of comparison for each row.
  • Identifies literacy as the one indicator on which the poorer pair differ substantially from each other — a finding invisible if the table is read row by row.
  • Lexis is precise and economical: disparity, an order of magnitude, near-universal, consistently, diverge.
  • Complex structures are used flexibly, including an appositive, a participle clause and a fronted concessive, with figures embedded naturally.

Model answers written and reviewed by The English All-in-One IELTS team. They are teaching models showing what each band looks like, not real candidate scripts.

This is a table question. The answers above show you what each band looks like when it is finished. What they cannot show you is how to get there from a blank page in forty minutes.

That is what our Writing Study Library is for: the structure we teach for this exact question type, the paragraph pattern that goes with it, and the sentence openers for each stage — so the essay is planned before you start writing rather than assembled as you go.

See the structure for this question type →

Vocabulary for this topic

Word or phraseMeaningUsed in a sentence
indicatora measure used to describe a country's conditionsThe table sets out four social and economic indicators.
disparitya large and unfair differenceThe disparity is widest in annual income.
life expectancythe average number of years a person is expected to liveLife expectancy was 47 years in Zaire.
an order of magnitudea factor of about tenThe income gap is two orders of magnitude.
near-universalalmost complete, close to 100 per centLiteracy was near-universal in both wealthy countries.
to divergeto differ noticeably from each otherThe poorer pair diverge sharply on literacy.
calorie supplythe amount of food energy available per personDaily calorie supply was little over half the Canadian level.
to hold (of a pattern)to remain true in every caseThe division holds on every indicator.

Write your own answer

Draft your response below, then get it marked against all four IELTS criteria. Your draft stays in this browser — nothing is published.

Common questions

How do I compare figures in completely different units?

Choose the right unit of comparison for each row rather than forcing one style. Income differences are best as multiples ("roughly a hundred times"), life expectancy as a difference in years, and percentages as points. Using "times" for years or "per cent" for dollars is where accuracy errors appear.

Should I group countries that behave similarly?

Yes, and here it is the whole structure of the answer. Canada and Japan resemble each other on every measure, as do Peru and Zaire, so grouping them lets each paragraph make a comparison instead of listing four separate sets of figures.

Is it worth pointing out where a pattern breaks?

It is often the most valuable sentence in the answer. Peru and Zaire are close on three indicators but differ twofold on literacy, which is a real feature of the table that a row-by-row description would bury.

Should I comment on what these figures mean about the countries?

No. Describing Zaire as poor because its income is $130 is already going slightly beyond the data; explaining why, or drawing conclusions about development policy, is well outside Task 1 and earns nothing.