
Table Task 1 Academic

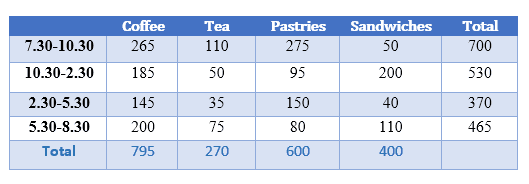
The table below shows the sales made by a coffee shop in an office building on a typical weekday

A full IELTS Academic Writing Task 1 answer to this table at Band 6.0, 7.0, 8.5, with the four-part structure, the comparison language it needs, and why each version scores what it does.

The question

You should spend about 20 minutes on this task.

The table below shows the sales made by a coffee shop in an office building on a typical weekday.

Summarise the information by selecting and reporting the main features, and make comparisons where relevant.

Write at least 150 words.

Table of sales at an office-building coffee shop on a typical weekday. From 7.30 to 10.30 sales total 700, driven by pastries at 275 and coffee at 265. From 10.30 to 2.30 they total 530 with sandwiches highest at 200. From 2.30 to 5.30 they total 370, and from 5.30 to 8.30, 465. Coffee leads overall at 795, ahead of pastries at 600, sandwiches at 400 and tea at 270.
Sales of four items at a coffee shop in an office building across four periods of a typical weekday.

What to select from this table

A table with row totals and column totals is really two stories at once — how busy each period was, and how well each product sold — and a good answer uses both. The reportable pattern is that each product has its own peak time that matches what people do in an office day: pastries and coffee in the morning, sandwiches at lunch. Describing sixteen cells one by one is the failure mode; describing when each product sells is the answer.

Structure

Introduction — Paraphrase: what is sold, where, over what parts of the day, and note that totals are given both ways.

Overview — No detailed figures: the morning period was much the busiest and the mid-afternoon the quietest, while coffee was the best-selling item overall and tea by far the weakest.

Body 1 — By time of day — the four period totals and what drove each one.

Body 2 — By product — the column totals and each item's peak period.

Model answers

Band 6.0 model answer

166 words

The table shows how many coffees, teas, pastries and sandwiches a coffee shop in an office building sold in four periods of a normal weekday.

The busiest time was the morning, from 7.30 to 10.30, when the shop sold 700 items. In this period pastries were the most popular with 275, and coffee was very close with 265. Tea was 110 and sandwiches were only 50.

Between 10.30 and 2.30 the shop sold 530 items. In this period sandwiches became the most popular product with 200, because it was lunch time. Coffee was 185, pastries 95 and tea only 50.

The quietest period was 2.30 to 5.30 with only 370 items. In the evening, from 5.30 to 8.30, the number increased again to 465.

In total, coffee was the best product with 795 sales, then pastries with 600, sandwiches with 400 and tea with only 270.

In conclusion, the shop was busiest in the morning and sold more coffee than any other product during the day.

Why this is Band 6.0

  • The table is covered accurately, including both sets of totals, which secures Task Achievement at this level.
  • The data is reported period by period with little grouping, so the pattern of peak times has to be inferred.
  • Vocabulary is adequate but repetitive: sold, number and period recur throughout.
  • Sentences are largely simple and compound, with figures presented one per clause.

Band 7.0 model answer

223 words

The table shows the number of coffees, teas, pastries and sandwiches sold by a coffee shop in an office building across four periods of a typical weekday, with totals given for each period and each product.

Overall, trade was heaviest in the early morning and lightest in the mid-afternoon, with a secondary rise in the evening. Coffee was the best-selling item across the day as a whole, while tea trailed a long way behind every other product.

The 7.30 to 10.30 period was comfortably the busiest, generating 700 sales — well over a third of the daily total. Pastries led marginally at 275, closely followed by coffee at 265, while sandwiches were almost irrelevant at just 50. Trade fell to 530 between 10.30 and 2.30, when the pattern changed completely: sandwiches became the leading item at 200, their highest figure of the day, with pastries dropping to 95. The quietest stretch was 2.30 to 5.30, at 370 sales, before business recovered to 465 in the evening.

Looking at products rather than periods, coffee was the strongest performer overall at 795, outselling pastries at 600, sandwiches at 400 and tea at only 270. Each item had a distinct peak: coffee and pastries sold best in the morning, sandwiches at lunchtime, and coffee again picked up in the evening, reaching 200 in the final period.

Why this is Band 7.0

  • The overview is separate, arrives early and identifies both the busiest and quietest periods and the best-selling item.
  • The answer is organised around the two sets of totals rather than reading across the grid, which produces comparison.
  • Less common lexis is used accurately: peak, trade, outsold, trailed.
  • Each product's peak period is identified, which is the underlying pattern in the data.

Band 8.5 model answer

260 words

The table records sales of four items at a coffee shop in an office building across four periods of a typical weekday, together with totals by period and by product.

Overall, the day had two peaks and one clear trough: business was heaviest in the early morning, fell to its lowest in the mid-afternoon, and recovered somewhat in the evening. Each product had its own peak period, and coffee was comfortably the best seller across the day while tea sold barely a third as well.

The opening period from 7.30 to 10.30 dominated the day, accounting for 700 of the 2,065 items sold — roughly a third of all trade. Its composition was heavily skewed towards pastries at 275 and coffee at 265, with sandwiches negligible at 50. The middle of the day reversed this: total sales fell to 530, but sandwiches rose fourfold to 200 while pastries collapsed to 95, exactly the pattern an office lunch hour would produce. The 2.30 to 5.30 period was the quietest at 370, and the evening produced a secondary peak of 465.

Read by product, coffee led throughout at 795 sales, ahead of pastries at 600, sandwiches at 400 and tea at 270 — meaning coffee outsold tea by almost three to one. What the columns reveal is that each item was concentrated in a particular part of the day rather than spread evenly: pastries earned 275 of their 600 sales before 10.30, sandwiches half of theirs between 10.30 and 2.30, and coffee alone sold consistently in every period, never falling below 145.

Why this is Band 8.5

  • The overview selects the shape of the day and the ranking of products, and states both without descending into figures.
  • Uses the two sets of totals for different purposes so nothing is reported twice, and identifies each product's peak as the organising pattern.
  • Notes proportional relationships — the morning share of the day, coffee's lead over tea — rather than only reporting raw counts.
  • Lexis is precise and economical: trade, peak, outsold, negligible, secondary peak, skewed.
  • Complex structures are used flexibly, with a fronted adverbial, an appositive and a participle clause, and figures embedded naturally.

Model answers written and reviewed by The English All-in-One IELTS team. They are teaching models showing what each band looks like, not real candidate scripts.

This is a table question. The answers above show you what each band looks like when it is finished. What they cannot show you is how to get there from a blank page in forty minutes.

That is what our Writing Study Library is for: the structure we teach for this exact question type, the paragraph pattern that goes with it, and the sentence openers for each stage — so the essay is planned before you start writing rather than assembled as you go.

See the structure for this question type →

Vocabulary for this topic

Word or phraseMeaningUsed in a sentence
tradethe amount of business doneTrade was heaviest in the early morning.
peakthe highest point in a seriesEach product had its own peak period.
troughthe lowest point in a seriesThe mid-afternoon was the clear trough of the day.
to outsellto sell more than something elseCoffee outsold tea by almost three to one.
negligibleso small it hardly countsSandwiches were negligible before 10.30.
skewed towardsweighted heavily in one directionMorning sales were skewed towards pastries and coffee.
compositionwhat a total is made up ofThe composition of sales changed completely at lunchtime.
secondary peaka smaller high point after the main oneThe evening produced a secondary peak.

Write your own answer

Draft your response below, then get it marked against all four IELTS criteria. Your draft stays in this browser — nothing is published.

Common questions

How do I write about a table with sixteen numbers?

Do not report them all. Use the row totals to describe the shape of the day and the column totals to rank the products, then pick out only the cells that explain those patterns — the lunchtime sandwich figure, the morning pastry figure. Selection is a marked criterion, not an optional shortcut.

Can I say the lunchtime peak in sandwiches is because it was lunch?

Better to describe the pattern than to explain it. "Sandwiches reached their highest figure of the day between 10.30 and 2.30" reports the data; asserting a reason edges into speculation. The Band 8.5 model gets close by noting it is the pattern an office lunch hour would produce, which is a description of shape rather than a claim about cause.

Should I calculate the grand total myself?

It is worth doing if the arithmetic is simple, because it lets you express a period as a share of the day — "700 of the 2,065 items sold" is far more informative than 700 alone. Keep such calculations minimal and approximate.

Is it acceptable to point out that a product sold consistently?

Yes, and it is often overlooked. Noting that coffee never fell below 145 in any period, while every other item swung sharply, is a genuine feature of the data that no single cell reveals.