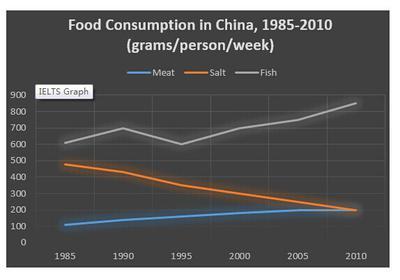
The graph below shows the changes in food consumption by Chinese people between 1985 and 2010
A full IELTS Academic Writing Task 1 answer to this line graph at Band 6.0, 7.0, 8.5, with the four-part structure, the comparison language it needs, and why each version scores what it does.
The question
You should spend about 20 minutes on this task.
The graph below shows the changes in food consumption by Chinese people between 1985 and 2010.
Summarise the information by selecting and reporting the main features, and make comparisons where relevant.
Write at least 150 words.
Weekly consumption of meat, salt and fish in China, 1985–2010, in grams per person.
What to select from this line graph
Three lines, and the important thing is that they do not all move the same way: one falls steeply, one rises steeply, and one rises gently until it meets the falling line at the end. That convergence between salt and meat is the single most reportable feature and belongs in the overview. Fish is the trap in the opposite direction from usual — it is the largest category and the most irregular, so it tempts candidates into describing every fluctuation when only the dip around 1995 is worth a clause.
Structure
Introduction — Paraphrase the rubric: what is measured, where, in what units, over what period.
Overview — Two sentences and no figures: fish was highest throughout and rose, salt fell sharply, meat rose gently, and salt and meat finished level.
Body 1 — The two that changed places — salt falling and meat rising — with the figures at each end and the point where they meet.
Body 2 — Fish on its own: consistently the largest, rising overall, with the mid-1990s dip noted briefly.
Model answers
Band 6.0 model answer
164 words
The line graph shows how much meat, salt and fish people in China ate from 1985 to 2010. The numbers are in grams for one person in one week.
In 1985, fish was the most popular food with about 620 grams. Salt was the second with about 480 grams, and meat was the lowest with only about 120 grams.
After that, salt decreased all the time. It was about 400 grams in 1990, then 350 grams in 1995, and finally only 200 grams in 2010. Meat did the opposite and increased slowly from 120 grams to about 200 grams. So in 2010 these two products had the same number.
Fish was always the highest. It increased to about 700 grams in 1990, then it decreased to about 590 grams in 1995, but after that it increased again and reached about 850 grams in 2010.
In conclusion, the consumption of fish and meat increased, but the consumption of salt decreased a lot during this period.
Why this is Band 6.0
All three categories are covered with accurate figures, which secures the foundation of Task Achievement, but the overview is mixed in with detail rather than separated.
Data is reported line by line with little comparison; the convergence of salt and meat is mentioned but not identified as the key change.
Trend vocabulary is adequate but repetitive — increased, decreased and went up carry almost all the meaning.
Sentence structures are simple and compound, and several sentences open the same way.
Band 7.0 model answer
215 words
The line graph illustrates the weekly consumption of meat, salt and fish per person in China over a twenty-five year period from 1985 to 2010, measured in grams.
Overall, fish remained the most heavily consumed of the three throughout and rose over the period, whereas salt declined steeply. The most notable development was that salt and meat, which began very far apart, finished at an identical level.
In 1985 salt stood at roughly 480 grams per week, around four times the figure for meat, which was only about 120 grams. From that point the two moved in opposite directions: salt fell consistently, reaching approximately 350 grams by 1995 and continuing down to 200 grams in 2010, while meat climbed gradually across the same years. By the end of the period both had converged on about 200 grams, meaning meat consumption had risen by roughly two thirds while salt had been reduced by more than half.
Fish followed a less regular path but was the largest category in every year. Beginning at around 620 grams, it rose to approximately 700 grams in 1990 before falling back to about 590 grams in 1995 — the only significant decline in the series. It then recovered steadily, finishing at roughly 850 grams, the highest figure recorded on the graph.
Why this is Band 7.0
The overview is separate, arrives early and contains no exact figures — the structural feature examiners check first in Task 1.
Categories are grouped by behaviour rather than listed one at a time: the two that converge are handled together.
Comparison language is used properly — whereas, by contrast, the reverse — and the crossover is treated as the significant event.
A range of structures including participle clauses and a relative clause, with figures integrated into sentences rather than stacked.
Band 8.5 model answer
238 words
The line graph compares weekly per-capita consumption of meat, salt and fish in China between 1985 and 2010, measured in grams.
Overall, the three foods moved in markedly different directions: fish and meat both rose while salt fell substantially. The clearest development was the convergence of salt and meat, which began the period roughly four times apart and ended it level, though fish remained the most consumed of the three in every year.
Salt and meat effectively exchanged their relationship over the period. Salt opened at approximately 480 grams a week and declined without interruption, passing 350 grams in 1995 and finishing at around 200 grams — a reduction of well over half. Meat, starting from a much lower base of some 120 grams, climbed gradually but consistently throughout, arriving at the same figure of roughly 200 grams by 2010. In other words, a gap of around 360 grams in 1985 had disappeared entirely twenty-five years later.
Fish was the dominant category in every year and the only one to fall and then recover. From about 620 grams in 1985 it rose to a little over 700 grams by 1990, before dropping back to approximately 590 grams in 1995 — the sole significant interruption in the series. Growth then resumed steadily, taking the figure to around 850 grams by 2010, comfortably its highest point and more than four times the level of either other food at that date.
Why this is Band 8.5
The overview selects rather than summarises: it names the divergence and the convergence as the defining features and leaves everything else to the body.
Grouping is justified by the data — the pair that swap relative positions, then the outlier — and each paragraph makes an explicit comparison rather than telling two separate stories.
The 1995 dip in fish is handled proportionately, in a single subordinate clause, rather than being described in detail.
Lexis is precise and varied: converged, halved, interruption, consistently, a little over, with accurate approximation language throughout.
Complex structures are used flexibly and economically — participle clauses, an appositive, a fronted adverbial — with figures embedded rather than listed.
Model answers written and reviewed by The English All-in-One IELTS team. They are teaching models showing what each band looks like, not real candidate scripts.
This is a line graph question. The answers above show you what each band looks like when it is finished. What they cannot show you is how to get there from a blank page in forty minutes.
That is what our Writing Study Library is for: the structure we teach for this exact question type, the paragraph pattern that goes with it, and the sentence openers for each stage — so the essay is planned before you start writing rather than assembled as you go.
Do I need to describe every rise and fall in a line?
No — selecting is part of the task, and describing every fluctuation is penalised under Task Achievement. Report the overall direction, the start and end figures, and any change that is genuinely significant, such as the 1995 dip in fish here. Everything else can be left out.
What should go in the overview?
The main features with no exact figures: which lines rose, which fell, which was highest, and the single biggest change. Putting numbers in the overview is the most common structural error in Task 1 and leaves you nothing distinct to say in the body paragraphs.
How do I group three categories into two paragraphs?
Group by behaviour rather than by name. Here salt and meat belong together because they move in opposite directions towards the same point, and fish belongs alone because it is the largest and the only one that dips. Grouping justified by the data is exactly what Band 7 and above requires.
Should I write a conclusion?
No. Task 1 requires an overview, not a conclusion, and a separate conclusion normally just repeats it. Once you have written a proper overview after the introduction, stop when the data has been covered.