
IELTS Writing Task 1: line graph questions
5 line graph questions with the original visual and a full model report at each band.
 Line graph
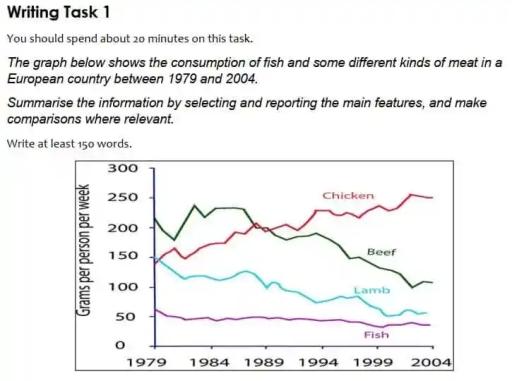
The graph below shows the consumption of fish and some different kinds of meat in a European country between 1979 and 2004
 Line graph
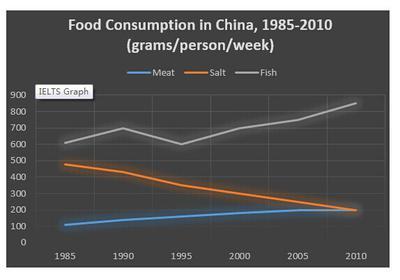
The graph below shows the changes in food consumption by Chinese people between 1985 and 2010
 Line graph
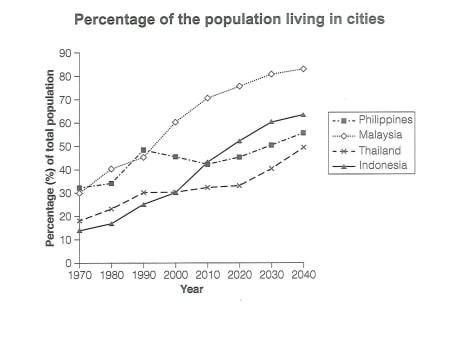
The graph below gives information about the percentage of the population in four Asian countries living in cities from 1970 to 2020, with prediction for 2030 and 2040
 Line graph
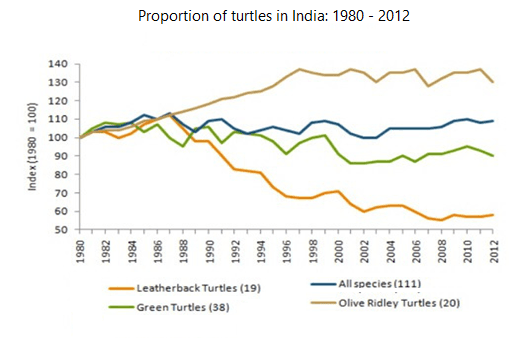
The graph below shows the population figures for different types of turtles in India from 1980 to 2012
 Line graph
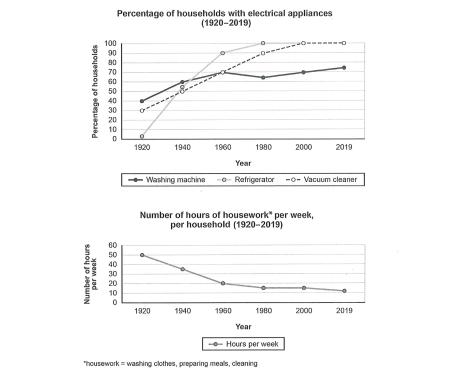
The charts below show the changes in ownership of electrical appliances and amount of time spent doing housework in households in one country between 1920 and 2019