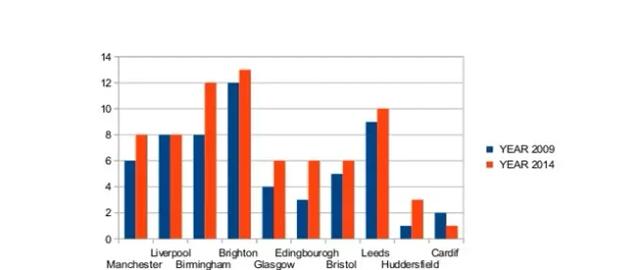
The bar chart shows the percentage of international students enrolled in universities in ten British cities in two years, 2009 and 2014
A full IELTS Academic Writing Task 1 answer to this bar chart at Band 6.0, 7.0, 8.5, with the four-part structure, the comparison language it needs, and why each version scores what it does.
The question
You should spend about 20 minutes on this task.
The bar chart shows the percentage of international students enrolled in universities in ten British cities in two years, 2009 and 2014.
Summarise the information by selecting and reporting the main features, and make comparisons where relevant.
Write at least 150 words.
Percentage of international students enrolled in universities in ten British cities, 2009 and 2014
What to select from this bar chart
Twenty bars, but only three things need saying: nearly every city rose, one city stands above the rest in both years, and exactly one city went the other way. Do not walk through all ten in order — group them by how much they moved, and give the exception a sentence of its own, because a single city bucking the trend is the most reportable feature on the chart.
Structure
Introduction — Paraphrase the rubric: a bar chart, the share of university enrolments made up by international students, ten British cities, compared across two years five years apart.
Overview — Two sentences, no figures: the proportion rose in almost every city over the period, with Brighton the highest in both years, while one city — Cardiff — was the sole exception and actually declined.
Body 1 — The cities at the top and those that rose most — Brighton, Birmingham, Leeds — with the figures and the size of Birmingham's increase.
Body 2 — The middle and lower group, the cities that rose modestly or not at all, ending with Cardiff as the only decline and Huddersfield as the lowest starting point.
Model answers
Band 6.0 model answer
141 words
The bar chart shows the percentage of international students who were enrolled in universities in ten cities in Britain. It compares the year 2009 and the year 2014.
In Manchester the percentage went up from 6% to 8%. In Liverpool it was 8% in both years. In Birmingham it went up from 8% to 12%. In Brighton it went up from 12% to 13%, which was the highest.
In Glasgow it went up from 4% to 6% and in Edinburgh it went up from 3% to 6%. In Bristol it went up from 5% to 6%. In Leeds it went up from 9% to 10%. In Huddersfield it went up from 1% to 3%.
Cardiff was different because it went down from 2% to 1%. Overall, the percentage of international students increased in most of the cities between 2009 and 2014.
Why this is Band 6.0
All ten cities are covered for both years and the figures are accurate, which meets the basic coverage requirement.
The cities are worked through one by one in chart order, so the report becomes a list of twenty numbers with no grouping and no sense of which changes matter.
There is an overview, but it says only that most cities increased; it does not identify Brighton's lead or single out the one city that fell.
Language is repetitive — went up, was and the percentage of carry nearly every sentence, and the structures barely vary.
Band 7.0 model answer
179 words
The bar chart compares the proportion of university enrolments accounted for by international students in ten British cities in 2009 and in 2014.
Overall, the share of international students grew in almost every city over the five-year period. Brighton attracted the highest proportion in both years, while Cardiff was the sole exception to the upward trend, ending the period lower than it began.
Brighton led throughout, rising from 12% to 13%, though its increase was marginal. The steepest increase belonged to Birmingham, where the figure climbed by four percentage points from 8% to 12%, bringing it close to Brighton by 2014. Leeds also remained near the top, edging up from 9% to 10%.
The remaining cities occupied the lower half of the scale. Edinburgh doubled its share from 3% to 6%, while Glasgow and Bristol each finished at 6%, and Manchester rose from 6% to 8%. Huddersfield, the lowest in 2009 at just 1%, tripled to 3%. Liverpool alone recorded no change at 8%, and Cardiff fell from 2% to 1%, leaving it the lowest of all in 2014.
Why this is Band 7.0
The overview comes early, contains no figures, and names both the leader and the single exception — the two things a reader most needs.
Cities are grouped by the size of their change rather than listed in chart order, which is what selecting main features looks like.
Comparative language is varied and accurate: the steepest increase, marginal, doubled, the sole exception.
A few of the smaller cities are still handled in a slightly list-like way, and Liverpool's flat result could be given more prominence.
Band 8.5 model answer
199 words
The bar chart sets out the percentage of university enrolments made up by international students across ten British cities, comparing 2009 with 2014.
Overall, international enrolment rose in eight of the ten cities over the period, and Brighton held the largest share in both years. The clearest departures from that pattern were Cardiff, the only city where the proportion fell, and Liverpool, where it did not move at all.
Brighton remained consistently ahead, though its lead narrowed: an increase from 12% to 13% was among the smallest on the chart, while Birmingham surged from 8% to 12% and closed much of the gap. Leeds occupied third place throughout, rising slightly from 9% to 10%, and Manchester advanced from 6% to 8%.
Growth was proportionally sharpest among the smaller centres. Edinburgh doubled from 3% to 6% and Huddersfield tripled from a negligible base of 1% to 3%, while Glasgow and Bristol both reached 6%, from 4% and 5% respectively. Two cities ran counter to this. Liverpool's share was static at 8% across both years, and Cardiff declined from 2% to 1%, leaving it the lowest of the ten by 2014 and the only city where international students became less prominent.
Why this is Band 8.5
The overview identifies the general trend, the leader and the exception in two controlled sentences, giving the whole picture before any detail.
Cities are handled in groups defined by behaviour — the leaders, the fastest risers, the low-and-rising, the two that did not rise — so every figure earns its place.
Language is precise and varied: consistently, closed much of the gap, from a negligible base, ran counter to, static.
The two anomalies, Liverpool's flat figure and Cardiff's decline, are treated together as the exceptions rather than buried in a list.
Model answers written and reviewed by The English All-in-One IELTS team. They are teaching models showing what each band looks like, not real candidate scripts.
This is a bar chart question. The answers above show you what each band looks like when it is finished. What they cannot show you is how to get there from a blank page in forty minutes.
That is what our Writing Study Library is for: the structure we teach for this exact question type, the paragraph pattern that goes with it, and the sentence openers for each stage — so the essay is planned before you start writing rather than assembled as you go.
Answers checked here may be published on this page, without your name, to help other learners. Nothing else about you is stored.
Common questions
Ten cities is a lot. Do I have to mention every one?
Yes, all ten must appear, but not in ten separate sentences. Group them by behaviour — the leaders, the fastest risers, the ones that barely moved — so several cities can share a clause. Walking through the chart left to right produces twenty numbers and no analysis, which is what keeps an otherwise accurate answer at Band 6.
Which is the more important change: Birmingham's four points or Huddersfield's tripling?
Mention both, because they are different kinds of increase. Birmingham's is the largest in absolute terms and changes the ranking at the top; Huddersfield's is the largest proportionally but moves it from 1% to 3%, which changes nothing about its position. Saying so explicitly is exactly the comparison Band 7 and above rewards.
Cardiff falls by only one percentage point. Is that worth highlighting?
It is the single most reportable feature on the chart. The size of the fall matters far less than the fact that it is the only fall — a city moving against the trend is a main feature, and putting it in the overview shows you have understood the data rather than merely read it.
The chart misspells two of the cities. Should I copy the spelling?
No — write Edinburgh and Cardiff correctly. The misspellings are errors in the printed chart, and copying them will be read as your own spelling mistakes under Lexical Resource. Never reproduce an error from the question paper.
Can I say why Brighton attracts the most international students?
No. The chart shows what the proportions were, not what caused them. Suggesting that seaside location or a particular university's reputation explains the figures is information the chart does not contain, and it costs marks under Task Achievement while using words the comparison needs.