
IELTS Writing Task 1: bar chart questions
15 bar chart questions with the original visual and a full model report at each band.
 Bar chart
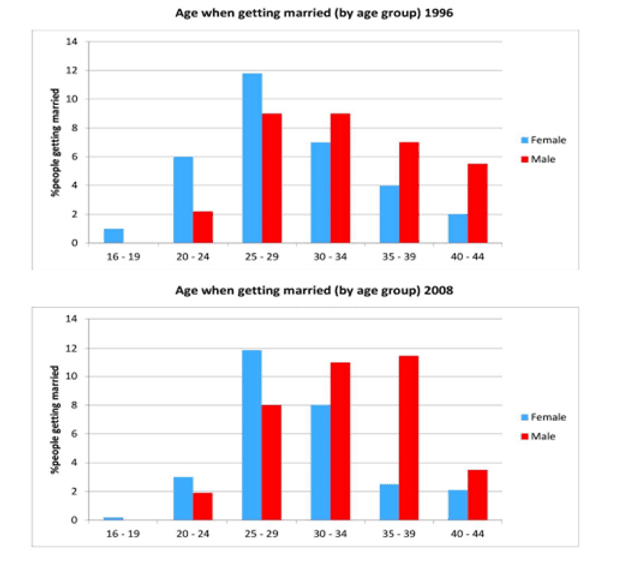
The charts below give information on the ages of people when they got married in one particular country in 1996 and 2008
Write this report →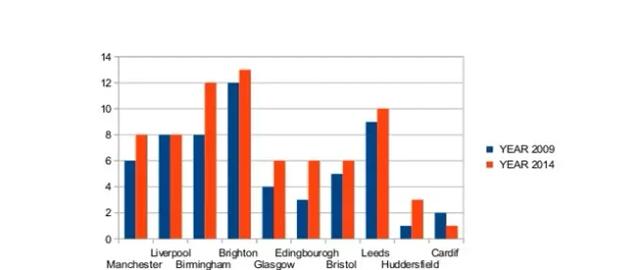 Bar chart
The bar chart shows the percentage of international students enrolled in universities in ten British cities in two years, 2009 and 2014
Write this report →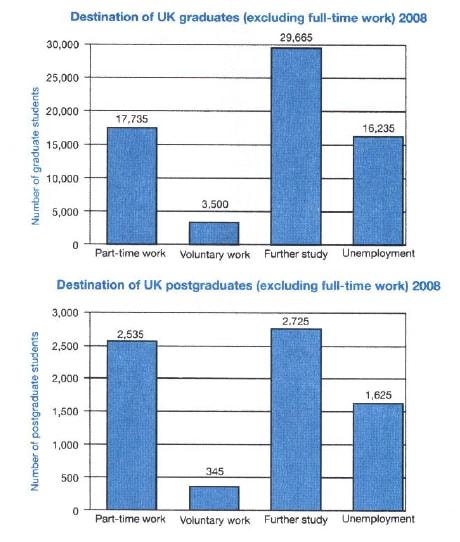 Bar chart
The charts below show what UK graduate and post graduate students who did not go into full-time work did after leaving college in 2008
Write this report →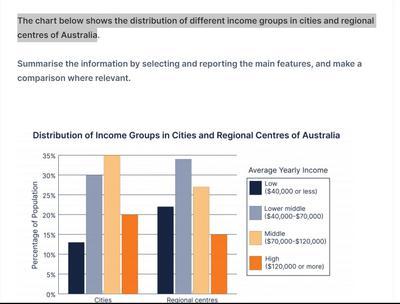 Bar chart
The bar chart depicts the distribution of income groups, namely low (40,000 dollars or less), lower middle (40,00 - 70,000 dollars), middle (70,000 - 120,00 dollars), and high (120,000 dollars or more) in the cities and the regional centers of Australia
Write this report →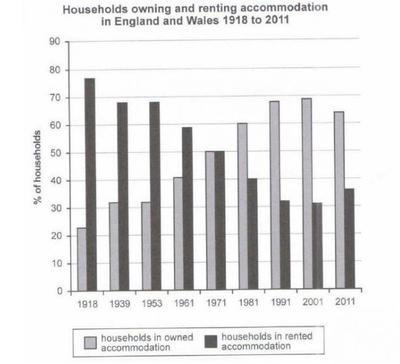 Bar chart
The given bar chart illustrates how many households owned and rented places in England and Wales during the period of 93 years
Write this report →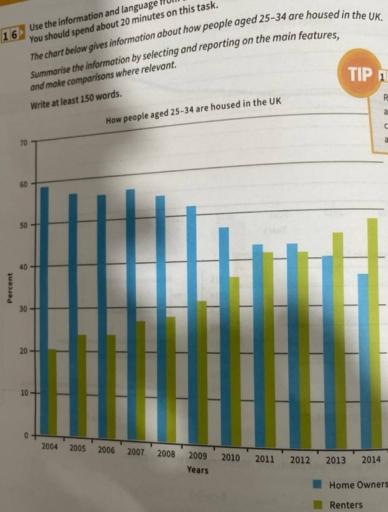 Bar chart
The chart below gives information about how people aged 25 - 34 are housed in the UK
Write this report →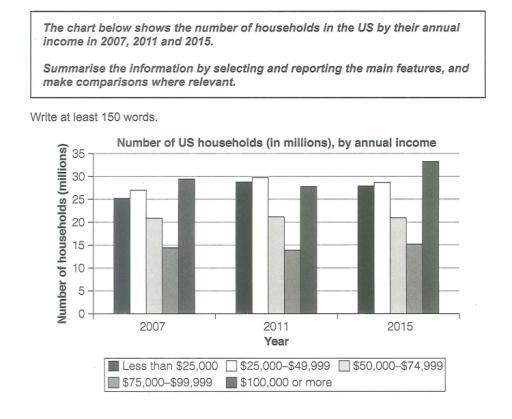 Bar chart
The chart below shows the number of households in the US by their annual income in 2007, 2011 and 2015
Write this report →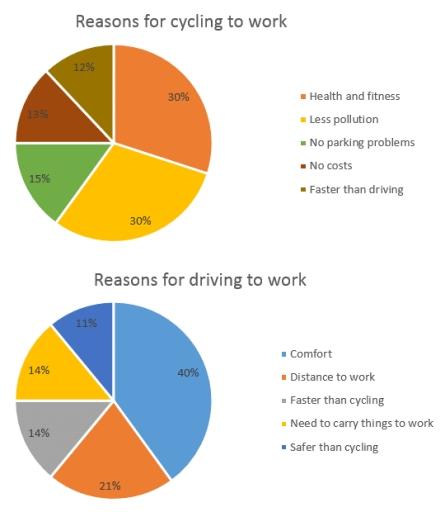 Bar chart
The chart below shows the reasons why people travel to work by bicycle or by car
Write this report →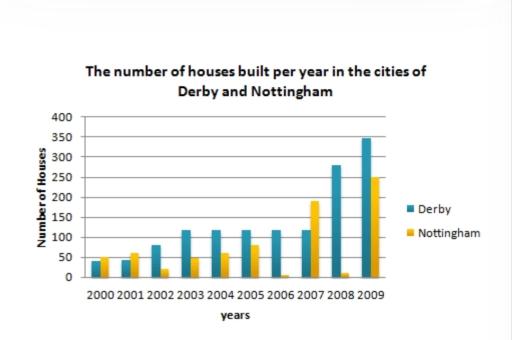 Bar chart
The bar chart below shows the number of houses built per year in two cities, Derby and Nottingham, Between 2000 and 2009. Write a report for a university lecturer describing the information shown below
Write this report →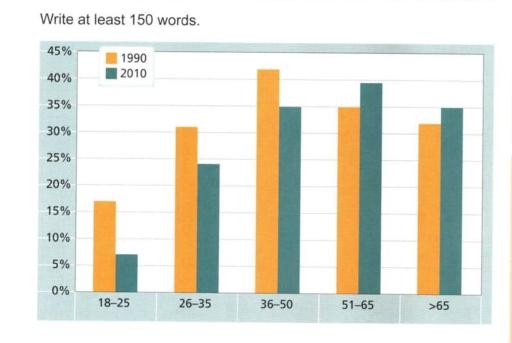 Bar chart
The chart below gives information on the percentage of British people giving money to charity by age range for the years 1990 and 2010
Write this report →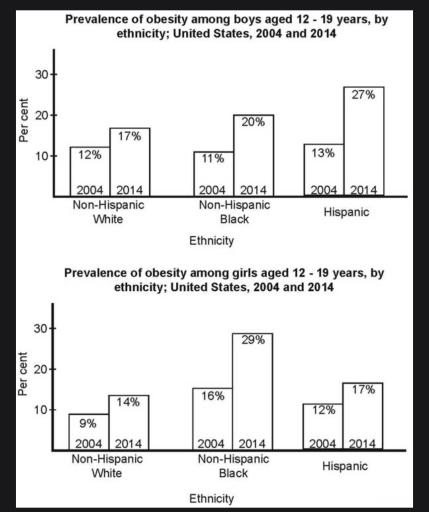 Bar chart
The bar charts below shows the prevalence of obesity among boys and girls aged 12 to 19 by ethnicity, in the United States for the years 2004 and 2014
Write this report →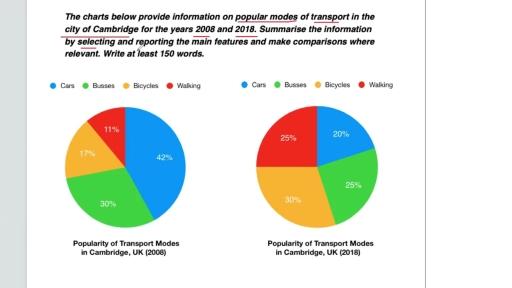 Bar chart
The charts below provide information on popular modes of transport in the city of Cambridge for the years 2008 and 2018
Write this report →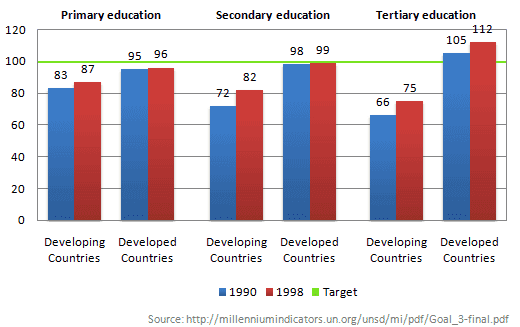 Bar chart
The chart below shows the number of girls per 100 boys enrolled in different levels of school education
Write this report →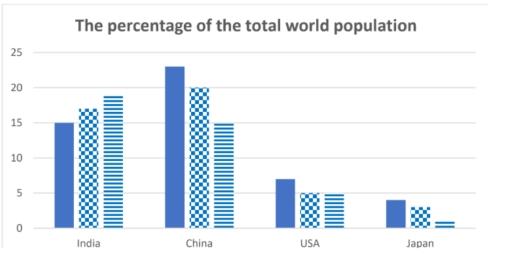 Bar chart
The bar chart shows the percentage of the total world population in 4 countries in 1950 and 2003, and projections for 2050
Write this report →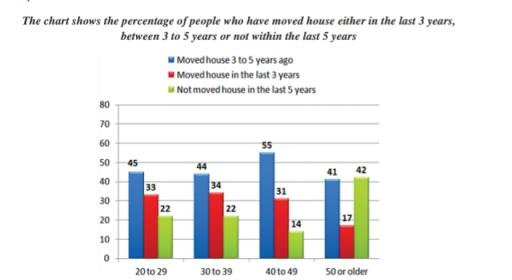 Bar chart
The bar chart shows the percentage of people who have moved house either in last 3 years,between 3years to 5 years,not within the last 5 years
Write this report →