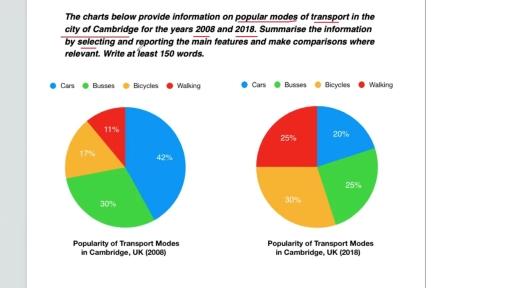
The charts below provide information on popular modes of transport in the city of Cambridge for the years 2008 and 2018
A full IELTS Academic Writing Task 1 answer to this bar chart at Band 6.0, 7.0, 8.5, with the four-part structure, the comparison language it needs, and why each version scores what it does.
The question
You should spend about 20 minutes on this task.
The charts below provide information on popular modes of transport in the city of Cambridge for the years 2008 and 2018.
Summarise the information by selecting and reporting the main features, and make comparisons where relevant.
Write at least 150 words.
Popularity of transport modes in Cambridge, UK, in 2008 and 2018.
What to select from this bar chart
Only four categories, so every mark comes from comparison. The reportable event is a complete reversal of the ranking: the mode that was most popular becomes the least, and the third becomes the first. Because these are shares of all journeys, the fall in car use is what funds the rise in cycling and walking — saying so is more informative than reporting the four pairs of figures separately.
Structure
Introduction — Paraphrase: what is measured, in which city, in which two years, as proportions.
Overview — No figures: car use fell sharply and lost first place to cycling, while walking rose substantially and buses declined only slightly.
Body 1 — The reversal — cars down, bicycles up, and the change in ranking.
Body 2 — Walking and buses, and the point that the gains were funded by the decline in driving.
Model answers
Band 6.0 model answer
171 words
The two pie charts show how people travelled in the city of Cambridge in 2008 and in 2018.
In 2008 the car was the most popular transport. It was 42 per cent, which is almost half of all people. The second was the bus with 30 per cent. Bicycles were 17 per cent and walking was only 11 per cent, so it was the last one.
In 2018 the situation was completely different. The car decreased a lot, from 42 per cent to only 20 per cent, so it became the least popular transport.
Bicycles increased from 17 per cent to 30 per cent and became the most popular transport in the city. Walking also increased a lot, from 11 per cent to 25 per cent.
The bus decreased a little, from 30 per cent to 25 per cent, so it was the only transport that did not change very much.
In conclusion, in ten years people in Cambridge used their cars much less and preferred to cycle or to walk.
Why this is Band 6.0
All four modes are covered for both years with accurate figures, which secures Task Achievement at this level.
The two charts are described one after the other, so the reversal is reported only at the end.
Vocabulary is adequate but repetitive: per cent, people and increased recur throughout.
Sentences are mainly simple and compound, with one figure per clause.
Band 7.0 model answer
210 words
The two pie charts compare the proportion of journeys made by four modes of transport in Cambridge in 2008 and 2018.
Overall, the ranking of the four modes was almost completely reversed over the decade. Car use fell by more than half and moved from first place to last, while cycling more than doubled its share to become the most popular option. Buses were the only mode to remain broadly stable.
The most substantial change concerned cars and bicycles. Cars accounted for 42 per cent of journeys in 2008, comfortably ahead of everything else, but had dropped to just 20 per cent by 2018 — a loss of twenty-two percentage points, or over half the original figure. Bicycles moved in the opposite direction, rising from 17 to 30 per cent and displacing cars at the top of the ranking.
Walking showed the largest proportional increase of all, climbing from 11 to 25 per cent, which is well over double and lifted it from last position to joint second. Buses, by contrast, changed only marginally, slipping from 30 to 25 per cent. Since these are shares of all journeys, the twenty-seven points gained by cycling and walking correspond almost exactly to the twenty-seven points given up by cars and buses combined.
Why this is Band 7.0
The overview is separate, arrives early and names the reversal of the ranking as the main development.
Modes are grouped by direction of change, and the ranking is tracked rather than the figures alone.
Proportional change is noted alongside percentage-point change, particularly for walking.
Comparison language is accurate: displaced, the reverse, correspondingly, marginal.
Band 8.5 model answer
259 words
The two pie charts compare the share of journeys made by car, bus, bicycle and on foot in Cambridge in 2008 and in 2018.
Overall, the ranking of the four modes was effectively inverted across the decade: the most popular option in 2008 had become the least popular by 2018, and the least popular had risen to joint second. Since the charts show shares of a fixed total, every gain here was necessarily funded by a loss elsewhere.
Cars account for the largest single movement. Having carried 42 per cent of journeys in 2008 — more than the two active modes combined — car use had fallen to only 20 per cent ten years later. That is a loss of twenty-two percentage points and represents well over half its original share, taking it from clear first place to last. Cycling rose almost as sharply in the opposite direction, from 17 to 30 per cent, and so displaced the car as the city's most common means of getting about.
Walking recorded the steepest proportional growth of any mode, more than doubling from 11 to 25 per cent and rising from last place to level with buses. Buses themselves were the one mode to change only slightly, easing from 30 to 25 per cent. Taken together, the twenty-seven points gained by walking and cycling match precisely the twenty-seven points surrendered by cars and buses — so the decade's shift was, in effect, a transfer from motorised transport to active travel rather than a change in the total number of journeys described.
Why this is Band 8.5
The overview identifies the complete inversion of the ranking, which is the single most reportable feature and cannot be seen from any one figure.
Frames the data as shares of a fixed whole, so gains are explicitly matched to losses.
Distinguishes absolute from proportional change and tracks position as well as size.
Lexis is precise and economical: inverted, displaced, active travel, correspondingly, marginal.
Complex structures are used flexibly, with a fronted concessive, an appositive and a participle clause, and figures embedded naturally.
Model answers written and reviewed by The English All-in-One IELTS team. They are teaching models showing what each band looks like, not real candidate scripts.
This is a bar chart question. The answers above show you what each band looks like when it is finished. What they cannot show you is how to get there from a blank page in forty minutes.
That is what our Writing Study Library is for: the structure we teach for this exact question type, the paragraph pattern that goes with it, and the sentence openers for each stage — so the essay is planned before you start writing rather than assembled as you go.
On a chart of shares, yes — it demonstrates that you understand the data rather than just reading it. The twenty-seven points gained by walking and cycling had to come from somewhere, and pointing out where turns four separate figures into a single coherent observation.
Should I report the change in ranking as well as the figures?
Always, when it moves. A mode falling from first to last is a more striking fact than a fall of twenty-two points, and it is invisible unless you look at the order rather than the values. On this chart the inversion is the answer.
Does this show fewer people drove?
It shows a smaller share of journeys were made by car, which is not quite the same. If total journeys grew, car trips could in principle have stayed level. Writing about shares keeps the claim accurate and costs you nothing.
Only four categories — is there enough for 150 words?
Yes, provided you compare rather than list. Four modes across two years gives you eight figures, four directions of change, two changes in ranking and a relationship between gains and losses — more than enough material once you stop describing each chart separately.