
Bar chart Task 1 Academic

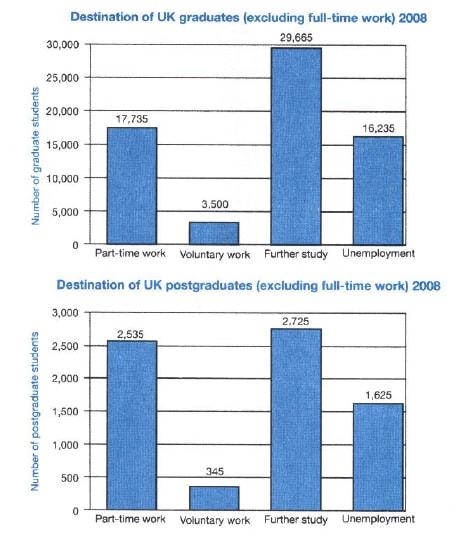
The charts below show what UK graduate and post graduate students who did not go into full-time work did after leaving college in 2008

A full IELTS Academic Writing Task 1 answer to this bar chart at Band 6.0, 7.0, 8.5, with the four-part structure, the comparison language it needs, and why each version scores what it does.

The question

You should spend about 20 minutes on this task.

The charts below show what UK graduate and post graduate students who did not go into full-time work did after leaving college in 2008.

Summarise the information by selecting and reporting the main features, and make comparisons where relevant.

Write at least 150 words.

Two bar charts showing what UK graduates and postgraduates who did not enter full-time work did after leaving college in 2008. Among graduates, further study was highest at 29,665, followed by part-time work at 17,735, unemployment at 16,235 and voluntary work at 3,500. Among postgraduates the same order appears at much smaller numbers, from 2,725 down to 345.
Destinations of UK graduates and postgraduates not entering full-time work, 2008.

What to select from this bar chart

The two charts have different vertical scales — one runs to 30,000 and the other to 3,000 — which is the single most important thing to notice. The bars look similar in height but represent completely different quantities, so any comparison must be about proportions rather than about how tall the columns appear. The order of the four destinations is identical in both groups, which means the interesting comparison is where the two differ in balance, not in ranking.

Structure

Introduction — Paraphrase: who is being described, which year, and that both charts exclude those in full-time work.

Overview — No figures: the ranking of destinations was the same for both groups, but graduates were roughly ten times as numerous, and unemployment was proportionally lower among postgraduates.

Body 1 — Graduates — the four figures, with further study dominant and voluntary work marginal.

Body 2 — Postgraduates — the same order at a much smaller scale, with an explicit proportional comparison against graduates.

Model answers

Band 6.0 model answer

144 words

The two bar charts show what UK graduates and postgraduates did in 2008 if they did not find a full-time job.

For graduates, the most popular choice was further study, with 29,665 students. The second was part-time work with 17,735 students, and after that came unemployment with 16,235 students. Voluntary work was the smallest group with only 3,500 students.

For postgraduates the order was the same, but the numbers were much smaller. Further study was again the highest with 2,725 students, then part-time work with 2,535 students. Unemployment was 1,625 students and voluntary work was only 345 students.

We can see that the number of graduates was about ten times bigger than the number of postgraduates in every category.

In conclusion, both groups chose further study most often and voluntary work least often, but there were many more graduates than postgraduates in this situation.

Why this is Band 6.0

  • Both charts are covered with accurate figures, which secures the basis of Task Achievement.
  • The charts are described one after the other and the difference in scale is noted only in passing, so the comparison stays shallow.
  • Vocabulary is adequate but repetitive, with students, number and work recurring.
  • Sentences are largely simple and compound, with figures presented one per clause.

Band 7.0 model answer

189 words

The two bar charts show the destinations of UK graduates and postgraduates who did not move into full-time employment after leaving college in 2008.

Overall, the four destinations appeared in exactly the same order for both groups, with further study the most common and voluntary work much the least. The clearest difference lies in scale, since roughly ten times as many graduates as postgraduates were involved, and in the proportion who were unemployed.

Among graduates, further study was the leading destination at 29,665, comfortably ahead of part-time work at 17,735. Unemployment was close behind part-time work at 16,235, meaning that almost a quarter of this group had no occupation at all. Voluntary work was marginal by comparison, accounting for just 3,500 people.

The postgraduate figures follow the same pattern at a much smaller scale, but with a notable difference in balance. Further study led again at 2,725, though only narrowly ahead of part-time work at 2,535 — a far tighter gap than among graduates. Unemployment stood at 1,625 and voluntary work at 345. Proportionally, fewer postgraduates were unemployed than graduates, and rather more of them were in part-time work.

Why this is Band 7.0

  • The overview is separate, arrives early and identifies both the shared ranking and the difference in scale.
  • The essay compares proportions rather than raw heights, which is the correct treatment of two differently scaled charts.
  • Less common lexis is used accurately: destination, identical, marginal, proportion.
  • Figures are integrated into sentences and the two groups are compared directly rather than described in sequence.

Band 8.5 model answer

218 words

The two bar charts compare what UK graduates and postgraduates did in 2008 when they did not enter full-time employment, giving the number of people in each of four destinations.

Overall, the ranking of destinations was identical for the two groups, with further study first and voluntary work a distant last in both cases. The substantive differences are of scale — graduates outnumbered postgraduates by roughly an order of magnitude — and of balance, since unemployment absorbed a noticeably larger share of graduates.

Among graduates, further study clearly dominated at 29,665, some two thirds more than part-time work at 17,735. Unemployment followed closely at 16,235, so of the 67,135 graduates covered, close to a quarter were without any occupation. Voluntary work was negligible in this context, attracting just 3,500 people, or around five per cent of the group.

The postgraduate chart reproduces this order on a much smaller base of 7,230 people, but the internal proportions differ in two respects. Further study again led at 2,725, yet by a far narrower margin — only about 190 ahead of part-time work at 2,535, where the equivalent graduate gap ran to nearly 12,000. Unemployment, at 1,625, accounted for roughly 22 per cent of postgraduates against about 24 per cent of graduates, while voluntary work remained the smallest destination at 345.

Why this is Band 8.5

  • The overview selects the two features that matter — identical ranking, different scale and balance — and states them without figures.
  • Handles the differing vertical scales explicitly, converting raw counts into proportions so the comparison is valid rather than visual.
  • Draws a comparison the charts do not state directly: the narrower gap between the top two destinations for postgraduates.
  • Lexis is precise and economical: destination, marginal, proportionally, an order of magnitude, narrower margin.
  • Complex structures are used flexibly, with a fronted adverbial, an appositive and a participle clause, and figures embedded naturally.

Model answers written and reviewed by The English All-in-One IELTS team. They are teaching models showing what each band looks like, not real candidate scripts.

This is a bar chart question. The answers above show you what each band looks like when it is finished. What they cannot show you is how to get there from a blank page in forty minutes.

That is what our Writing Study Library is for: the structure we teach for this exact question type, the paragraph pattern that goes with it, and the sentence openers for each stage — so the essay is planned before you start writing rather than assembled as you go.

See the structure for this question type →

Vocabulary for this topic

Word or phraseMeaningUsed in a sentence
destinationwhat someone goes on to do after finishing a courseFurther study was the leading destination for both groups.
an order of magnitudeabout ten times larger or smallerGraduates outnumbered postgraduates by an order of magnitude.
proportionallyas a share of the group rather than in raw numbersProportionally, fewer postgraduates were unemployed.
marginthe size of the gap between two figuresFurther study led by a far narrower margin among postgraduates.
negligiblevery small in comparison with the restVoluntary work was negligible in this context.
basethe total number the percentages are calculated fromThe postgraduate chart works from a much smaller base.
to reproduce a patternto show the same shape at a different scaleThe second chart reproduces the same order at a smaller scale.
to absorb (a share)to account for a proportion of a totalUnemployment absorbed a larger share of graduates.

Write your own answer

Draft your response below, then get it marked against all four IELTS criteria. Your draft stays in this browser — nothing is published.

Common questions

What do I do when two charts have different vertical scales?

Say so, and compare proportions rather than bar heights. Two columns of similar height can represent 29,665 and 2,725, so a comparison based on how the charts look would be simply wrong. Converting to shares of each group is what makes the comparison valid.

Should I calculate totals or percentages myself?

Only simple ones, and only if you are confident. Adding four figures to get a group total, or noting that a category is about a quarter of it, adds genuine comparison. Elaborate arithmetic risks an error that costs more than the sentence gains.

The order is the same in both charts — is there anything to write?

Yes: sameness is a main feature, and after stating it you compare the balance instead. Here the top two destinations are nearly level for postgraduates but far apart for graduates, which is a real difference hiding behind an identical ranking.

Do I need to mention that full-time workers are excluded?

It is worth one clause in the introduction, because it changes what the figures mean — these are not all graduates, only those who did not go into full-time work. Paraphrasing the rubric accurately is part of Task Achievement.