
Band 6.0 model answer
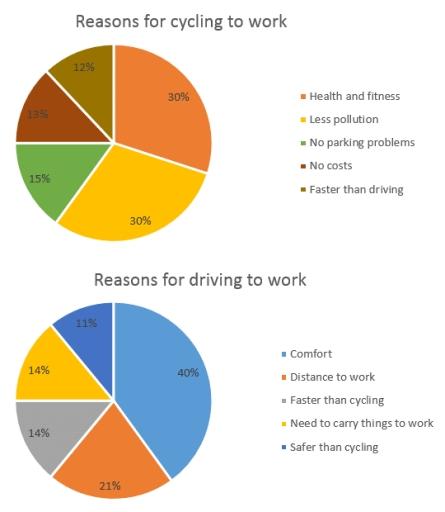
182 wordsThe two pie charts show the reasons why people go to work by bicycle and the reasons why other people go to work by car.
For cyclists, there were two main reasons with the same percentage. Health and fitness was 30 per cent and less pollution was also 30 per cent. After that, no parking problems was 15 per cent, no costs was 13 per cent and faster than driving was only 12 per cent.
For drivers, the most important reason was comfort with 40 per cent, which is much bigger than all the other reasons. The second reason was distance to work with 21 per cent.
Two reasons had the same percentage for drivers: faster than cycling was 14 per cent and the need to carry things to work was also 14 per cent. The last reason was safer than cycling with 11 per cent.
It is interesting that both groups said their transport was faster than the other one.
In conclusion, cyclists chose their bicycle mostly for health and for the environment, but drivers chose their car mostly for comfort.
Why this is Band 6.0
- Both charts are covered with accurate figures, which secures Task Achievement at this level.
- The charts are described one after the other with only a brief comparison at the end.
- Vocabulary is adequate but repetitive: per cent, people and reason recur throughout.
- Sentences are largely simple and compound, with one figure per clause.